
What is a converted wave?
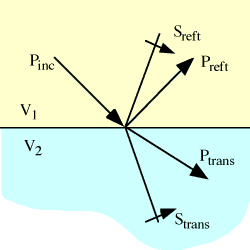
When a wavefront from a conventional seismic source strikes an interface, the reflected energy is partitioned into P (pressure) and S (shear) waves.
This diagram shows an incoming P-wave Pinc travelling at velocity V1 striking the interface between the upper (yellow) material and the lower (blue) material. Two reflected waves and two transmitted waves are produced as a result:
- Reflected shear: Sreft
- Reflected pressure: Preft
- Transmitted shear: Strans
- Transmitted pressure: Ptrans
Energy conversion in action
The figure on the right is from an animation of P-wave to S-wave conversion. When viewing the animation, Note the velocity difference between the P and S waves. Typical sedimentary rocks have a VP/VS ratio of between 1.5-2.5 .
Also note the difference in the direction of particle motion relative to the direction of wave propagation. P-waves have particle motion in the same direction as wave propagation, while shear waves have particle motion in a direction perpendicular to wave propagation.
This is, of course, a very simple animation, where wave propogation is represented by a one-dimensional 'string of beads' model.
Reflectivity variation with offset
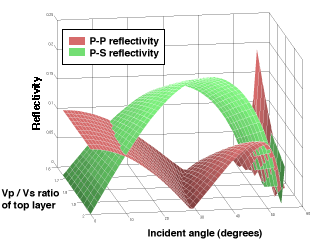
The P-P and P-S reflectivity varies as a function of the media parameters and the incident angle.
The reflection and transmission functions are described by the Zoeppritz equations.
Here is a plot of the P-P reflectivity and the P-S reflectivity as a function of incident angle and the ratio between the VP and VS in the top layer.
This can lead to very significant Amplitude Versus Offset (AVO) affects.